Presenting data clearly, digestible, can take a lot of time and effort. When presented with overwhelming numbers, people tend to tune out or, worse, ignore the data altogether. Data charts and visualizations can help solve this problem by presenting data in a way that’s easy to understand and share. Data visualization is becoming more and more important in all industries, from science to business planning.
That is why we will focus our attention on how to create a pie chart in Google Slides and keep your audience engaged.
Why use radial charts?
The key to a successful data visualization is simplicity. Creating complicated charts that nobody but the presenter can understand makes for an ineffective presentation. However, creating a chart with too few elements can make your numbers appear unclear and unimportant. That’s why Google Slides has a feature that helps you create radial charts – perfect for data visualizations because they’re easy to read and paint the full picture of a dataset in an aesthetically pleasing way.
So…
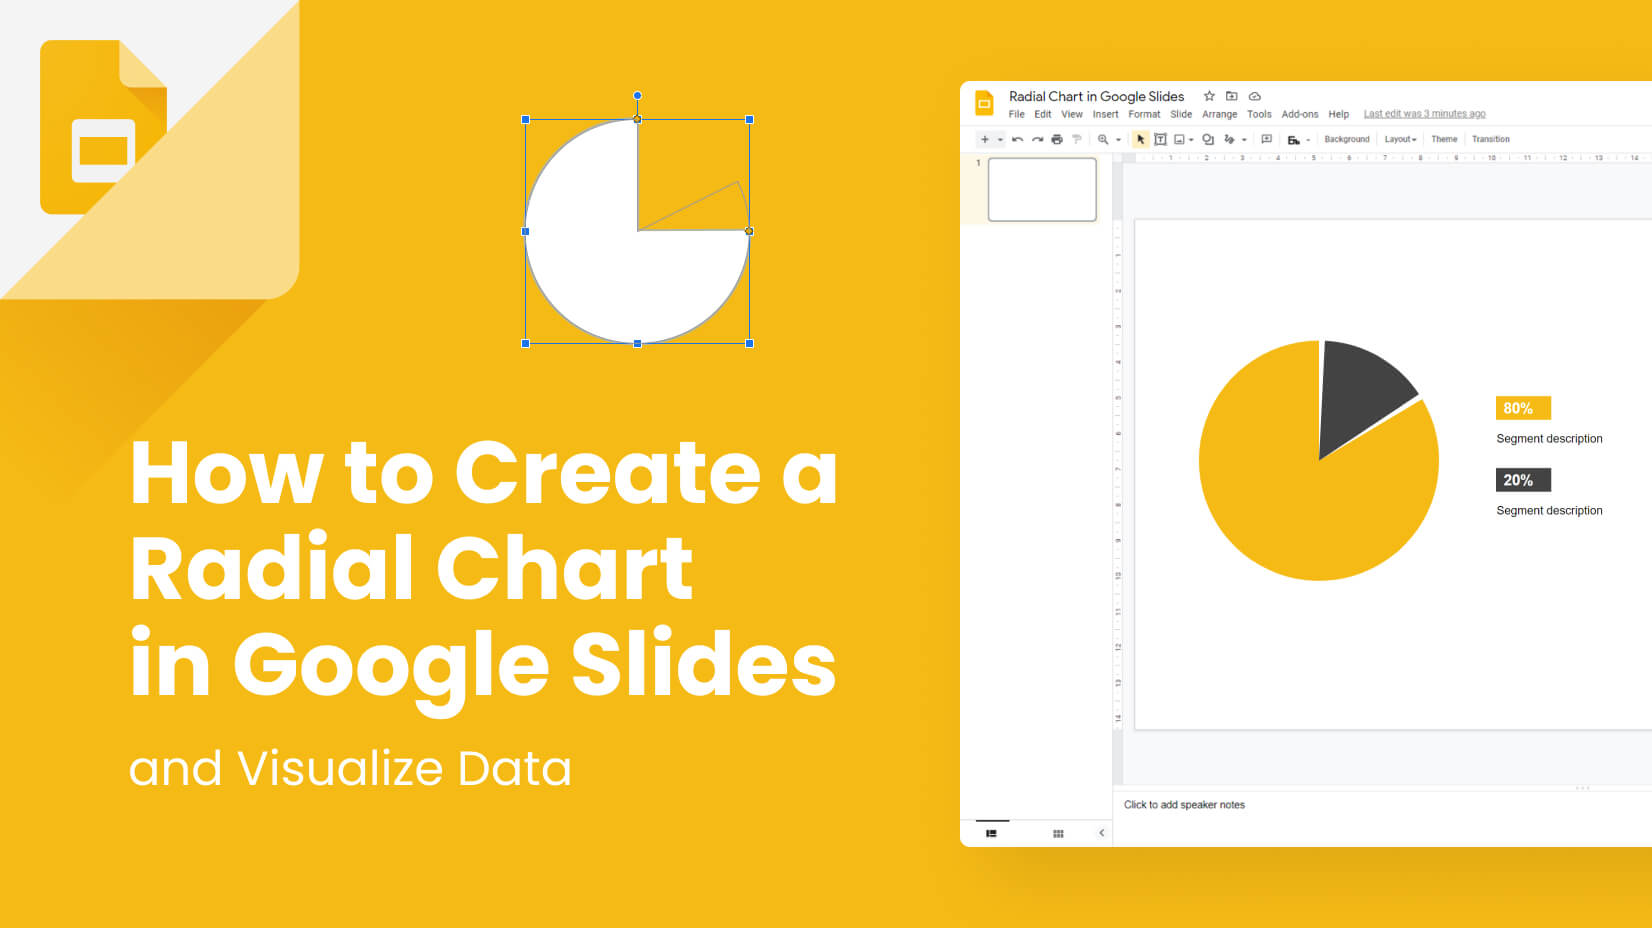
How to Create a Radial Chart in Google Slides?
Let’s see how to create a radial chart in Google Slides and impress your audience.
Step 1. Open Google Slides
First and foremost, you should open your Google Slides. Bear in mind you should have an already created Google Account, in order to use any Google tool.
Step 2. Open/Create a New Presentation
Now, you should open a presentation of your choice and then select the slide you wish to add your chart in.
Step 3. Add a Pie Shape

It has come time to add the Pie shape. Bear in mind you should NOT add a Chart but a Shape. To add the Pie shape, you should click on Insert->Shape->Shapes->Pie. Тhen, you can pick the other attributes, such as Fill Color, Border Color, Border Weight, and Border Dash to further design your pie chart. It’s a good idea to use the brand colors.
Step 4. Duplicate the Pie shape and create a second outer body

You will have to Copy (Ctrl+C) and Paste (Ctrl+V) your Pie shape, in order to create the second outer body. Then, start modifying it. We will have to leave some space between the two outer bodies in order for the radial chart to work. Also, the shapes should have some symmetry, otherwise, you’d lose the visual effect.
Step 5. Create a legend

One of the key things about radial charts is that they visualize data. Thus, it becomes a necessity to provide numerical values in order for your audience to connect the dots. For this reason, you should go to Insert->Shape->Shapes and then you could select a shape from the first raw, let’s say a Rectangle (the first figure).
Step 6. Finish the figure

It’s time to enter the data then, format the shapes and add a font size, color, etc. Of course, you can add title and a descriptive text if you wish.
Video Tutorial:
Conclusion
This guide showed you how to make a radial chart in Google Slides. Hope we helped us successfully create your first one. These charts are very good-looking and you can grab your audience’s attention if using one. If you want to learn more tutorials on working with Google Slides, take a look at our article with 20 beginner-friendly tutorials.
If you’re interested to learn about infographics, you can check some of our other tutorials:
- 35 Free Google Slides Infographic Templates
- The Best Free Infographic Templates in 2022 for Every Software
- 30+ Free Comparison Infographic Templates