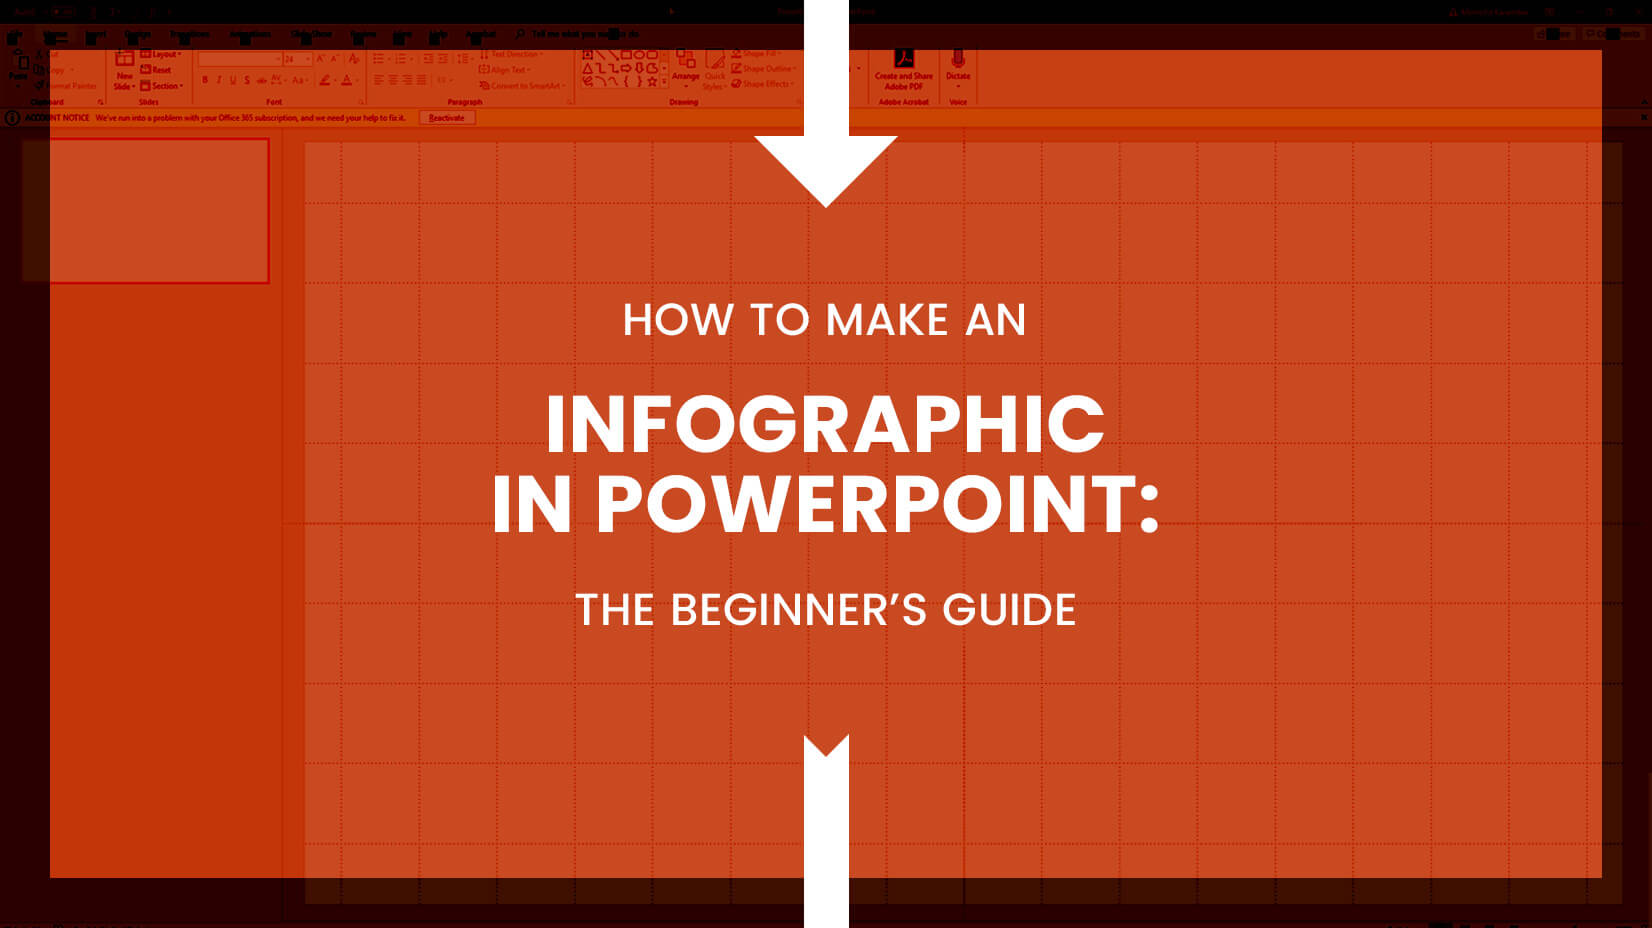
How to Make an Infographic in PowerPoint: The Beginners’ Guide
A beginner-friendly tutorial that covers the basics of how to create an infographic in PowerPoint.
A beginner-friendly tutorial that covers the basics of how to create an infographic in PowerPoint.
Today, we’ll be talking about how to make an infographic in PowerPoint and it’s way easier than you think!
Why choose PowerPoint for your next infographic? Microsoft’s popular software for presentations is loaded with so many features and design tools that in fact, it includes everything you need in order to make an infographic in PowerPoint. Moreover, you probably already have it installed on your PC and are familiar with its interface.
For the purpose of this tutorial, we’ll assume that you have set your topic, gathered your content, and have established the structure of the infographic you’ll be making. If you need insight on this part of preparing your infographic, take a look at our in-depth guide on how to make an infographic. Now, let’s begin!
The first step is to prepare your canvas. Unlike presentations which are usually designed in 4:3 or 16:9 horizontal layouts, most infographics are vertical. This means that the first thing to do is change the layout and adjust the size of your infographic.

Now, the size of your infographic depends on the volume of information you need to visualize. It also depends on where you are going to publish it: on your blog, on social media channels, as a printed poster, etc.
For social media channels, a width of 600px is enough in terms of readability. If you are making the infographic for Pinterest, have in mind that the maximum preview size of a pin is 1:2.1 aspect ratio (e.g. 600 x 1260 px), and for other social media channels it’s even less. However, our recommendation is to make your infographic in retina size, i.e. twice this width.
Related: How to Design Awesome Graphics For Social Media
Now, back to PowerPoint. Go to Design tab > Slide Size > Custom Slide Size. We set our infographic to a 1:4 aspect ratio. You could make it 1:1, 1:2, 1:2.5, etc. depending on your needs. Note that resizing the canvas in PowerPoint is a little tricky. From our experience, it is better to ensure a bigger length and cut it off later.
In our case, we set the sizes to 12.5 x 50 inches (1200 x 4800 pixels) retina size. You could use half these dimensions for a non-retina design – 6.25 x 25 inches (600 x 2400 pixels). Regarding Maximize or Ensure Fit window, you don’t have any content for the moment, so just click one of the two options.

The next step is to clear up the default title and subtitle placeholders. Go to Home > Layout > and choose Blank, or simply click on each of them and press Delete. Your canvas should look like this:

Turn rulers, gridlines, and guides on to align your design elements, achieve symmetry (or asymmetry – depending on what you aim for). These tools will help you design a precise and aesthetically pleasing infographic. Go to View and check Rulers, Gridlines, and Guides.
If you need to make adjustments, click on the little arrow icon in the lower right corner to open Grid and Guides pop-up window with settings.

The background of your infographic can remain white but if you’d like, you can change it via Design > Format Background. Choose among a solid fill, gradient fill, picture, texture, or a pattern fill. In our case, we picked a light blue color.

Let’s start building the design. You can easily create the header section of your infographic by using PowerPoint’s shapes. Go to Insert > Shapes and choose the Rectangle shape. Once you place the shape, you’ll see all the design settings that appear.

Once you’ve adjusted the shape (you can change the colors and style later), start typing your text. Play with the fonts and sizes to achieve a cool effect. You can also combine two fonts, e.g. serif and sans serif fonts, handletter fonts and typewriter fonts, and more combinations. Just make sure to keep the aesthetic of the design.

Of course, you can experiment with font colors and make color combinations. Have in mind that the colors you choose determine how your viewers will perceive the information. Make sure that:

Moreover, you can jazz up the font by adding a custom element. In this case, we experimented with replacing the first letter of “PowerPoint” with the PowerPoint’s logo via Insert > Picture.
![]()
You may also be interested in How to Add Audio to PowerPoint: Quick Step-by-Step Guide
By using PowerPoint’s library of shapes, you can create various interesting designs for the body of your infographic. For this tutorial, we decided to add a little bit of depth. We’ve used 3 different shapes to recreate a 3D effect and an arrow pointing down:

For the triangle, use the same tone of blue for a fill color as the rectangle above in order to complete the design of the arrow. The next step would be to add more design elements and start distributing your content.
If you decide to break your content into steps, here is an idea of how to do it. We’ve used the built-in shapes in PowerPoint to create design elements to position the texts for each element. You can add shadows to elements via Format Shape to make these fields “float” over the arrow.

Once you decide how to position your elements, start typing your text. To make the sections look like steps, we’ve added big numbers. Make sure to align the text inside, so it doesn’t go under the numbers.

No matter of your design, you will probably need to use icons at some point. Icons support your message and make content easier to understand. One way to do this is to use PowerPoint’s library of icons at Insert > Icons.
![]()
Once inserted, you can easily position the icons in your design. Resize them as much as you need. Don’t worry, they work like vectors, so they won’t lose quality. Changing colors is also easy. We used the same nuance of yellow as the one we used for the numbers.
![]()
Another way to add icons to your infographic design is to import custom icons as vector graphics via Insert > Pictures. The latest version of PowerPoint supports the vector file format SVG which is the recommended file format for imported icons. They are light, easy to edit and won’t lose quality when resized.
In PowerPoint, you can easily add graphs, charts, and other design elements for visualizing your data by using SmartArt. Go to Insert > SmartArt and you will find that there are several categories of data visualization graphics: list, process, cycle, hierarchy, and more.

The variety of graphs is large and the options for editing are many. From the design panel, you will find different styles and color schemes to apply to the graph. Also, you can easily delete parts of the graph, change shapes, add shapes, add text and more editing options, so that it matches your design just the way you imagine it.

You can also add custom graphic templates for data visualization. The file format accepted by PowerPoint is EMF and it gets transformed into a fully editable vector shape. Unfortunately, PowerPoint no longer supports the most popular vector file format EPS. This means:
Simply drag and drop the image file into the canvas in PowerPoint and the software will place it onto your design. To make it fully editable, right-click with the mouse and choose Group > Ungroup.

Then, PowerPoint will ask you to convert the image into a drawing object. Click Yes.

Now the graphic is fully editable. You can change sizes of elements, text, colors, and delete elements if you have to. In the example below, we deleted the background and changed the colors of one of the design elements. You can easily make any kinds of edits.

Once you are ready with positioning your elements, don’t forget to add a footer where to cite all the sources you’ve used. You can easily create the footer by adding a rectangle shape just like you did for the header or jazz it up with a more unconventional form like we did.

And that’s about it! These are the basics you need to know when it comes to creating the design of your infographic in PowerPoint. All that’s left for you is experiment and try different looks until you are happy with the design.
It’s easy to save the final infographic design into an image file. Simply go to Save As and choose your preferred option from the dropdown menu. We recommend PNG or JPG file formats. Then, PowerPoint will ask you if you want to export all slides or just this one. Select Just This One and voila!

We are really curious to see the designs you’ve come up with. Come on and share with us your creations in the comments below.
Hopefully, we helped you understand the basics of creating an infographic in PowerPoint. The software is really loaded with amazing tools and resources to help you create beautiful designs. If you’d like to dig deeper into the subject of creating infographics, have a look at How to Make an Engaging Infographic: The Full Guide. See ya!


 Character Animator Tutorials Part 4: Rigging and tools
![How to Make an Infographic in Less Than 5 Minutes [Step-by-step Tutorial]](https://i.graphicmama.com/blog/wp-content/uploads/2020/02/26144724/how-to-make-infographic-tutorial-120x70.png) How to Make an Infographic in Less Than 5 Minutes [Step-by-step Tutorial]
How to Make an Infographic in Less Than 5 Minutes [Step-by-step Tutorial]
 21 InDesign Tutorials To Become a Great Publisher in 2022
 How to record a Zoom presentation and present in a virtual meeting?
 How to use Google Slides offline and Work Anywhere?
Don’t forget to share!

Iveta is a passionate writer at GraphicMama who has been writing for the brand ever since the blog was launched. She keeps her focus on inspiring people and giving insight on topics like graphic design, illustrations, education, business, marketing, and more.
Here are some other articles we think you may like:
A source of high-quality vector graphics offering a huge variety of premade character designs, graphic design bundles, Adobe Character Animator puppets, and more.
Browse our graphics